Your mobile game is taking off. The graphics are remarkable and players are responding enthusiastically. But how can you methodically track just how well you’re really doing, and what are the most effective ways to do this? Data.
To get a real and authentic sense of your app’s success, it’s imperative that you know which KPIs are worth monitoring.
So, which metrics should you start with? Here are the top 14 KPIs every gaming CMO should be tracking.
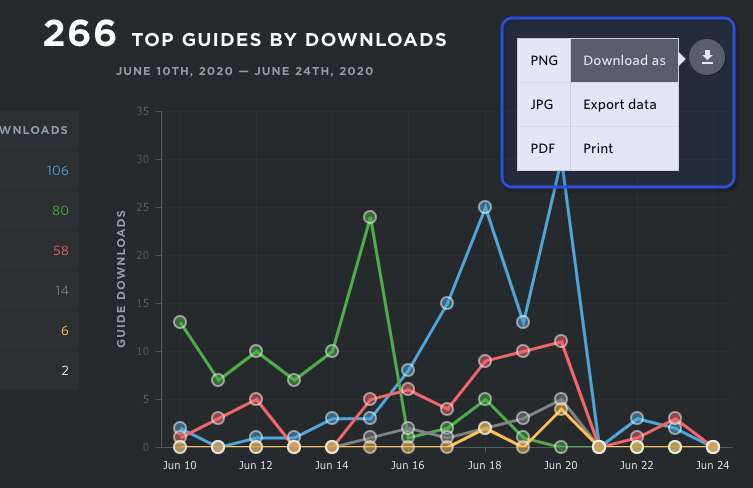
- Number of downloads
The number of times a game is downloaded to a mobile device is one of the most straightforward indicators of popularity.
Every CMO should be tracking game downloads, for this KPI forms the basis of all subsequent measurements.
That doesn’t mean this is the end-all, be-all–after all, customers don’t have to do much in order to download an app. The question that you want to be able to answer–that these KPIs will all help you answer–is whether customers are actually engaging with your game once it’s on their phone.
- Where downloads are occurring
Where are the downloads taking place globally? Knowing where your app is popular can help you with marketing strategies down the road.
Social media advertising and paid advertising on Google or Amazon can all be targeted by geographical location in addition to countless other criteria, so if your game is getting huge in Eastern Europe (and we’ve seen that happen), you’ll be able to target those customers more closely.

- Sign ups
The number of downloads doesn’t always correlate with the number of sign ups. Are a lot of people downloading your game, but not completing the sign up process?
If there’s a disparity between downloads and sign ups, that could point to a couple different issues:
- A glitchy, confusing, or inconvenient sign-up process. Are you requesting too much information from customers? Are there technical issues causing data not to be captured, or sign-ups not to be tracked?
- A mismatch between your initial marketing and the experience customers are getting when they go to sign up. Are there critical differences between what you’re telling the customer, and what they’re actually getting?
Once you’ve examined the potential problems, you can make the necessary changes and updates, and continue tracking. If sign-ups go up, you’re on the right track; if not, you’ll have to look for other issues.
The reason this matters is because when users sign up, they are more likely to come back and play your game again and again. This is why the sign up process is such a critical part of the process. You want to make it as easy as possible. Attention spans are short, and competition is fierce.
- Retention rate
Retention rate measures the amount of people that are continuing to play your game after a set period of time.
For instance, let’s say 20,000 individuals downloaded your game today. Fast forward a week from now, and from those original 20,000 players, 12,000 are still playing. That would give a retention rate of 60% over the course of one week.
Here’s how you figure that out, courtesy of Game Analytics:
Retention Rate = ((CE – CN) / CS)) X 100
CE = number of customers at the end of the period
CN = number of new customers acquired during the period
CS = number of customers at the start of the period
At face value, high retention rates could indicate popularity while low retention rates could point to specific issues, such as frequent crashes or a poor user experience. However, your retention rate will naturally decrease over the initial 28 days after release, which is the standard period for measuring retention for new games (typically the measurement is done on day 1, 7, and 28). Acceptable retention rates by day are in the range of:
- Day 1 Retention – 40%
- Day 7 Retention – 20%
- Day 28 Retention – 10%
- Crashes
App crashes are not ideal, but fixable, and important to monitor. Track when, specifically, your game experiences technical issues.
What happens right before a crash?
How often is this occurring?
Are all users experiencing the same issue?
Ultimately, this comes down to improving the user experience through design changes, technical fixes and updates, and even changes in marketing to avoid massive usage at one time.
If you’re releasing an update, for example, rather than push an announcement out via social ad to all your users across every geographic region, space your ads so that people living in different areas see it at different times, or on different days.
- Unresponsive gestures
Similar to app crashes, unresponsive gestures point to mechanical errors. This type of inaccuracy occurs when a user “gestures” on their mobile screen and nothing happens.
Unresponsive gestures are a sign of an app defect and will have a negative impact on the consumer’s satisfaction with your game. If unresponsive gestures occur frequently, players are likely to abandon your app for another. And it’s very hard to bring them back, so make sure you test your game thoroughly with users before releasing it.
This goes without saying, but just like you wouldn’t conduct market research with only a single demographic, you need to test your game with users of different ages, genders, and even sizes to make sure the gestures work for everyone (Why sizes? A person with a smaller hand will have more trouble making gestures or swipes that span the entire screen top to bottom, for instance).
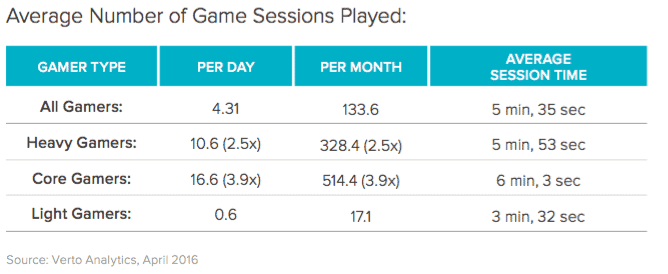
- Average session length
It’s important to see how much time users spend on your game per session. Determining what defines a session can differ across from platforms, but typically, it covers all app activity until one exits out of the game or, according to industry standards, “inactive for 30 minutes.”
It’s worth noting that session lengths vary across games and game genres. Make sure you’re benchmarking your game against others in that genre–role-playing games, time management games, etc.

- Session interval
The session interval is the amount of time between sessions. Do users typically play your game daily, weekly monthly? Do the session intervals differ among users?
In general terms, brief intervals are preferred over long ones, but it’s important to look at the big picture.
Is there a correlation between game updates and session intervals?
Is there a particular time of the day or week that has especially high levels of engagement?
Long session intervals aren’t automatically cause for concern. The more important thing is to plug this KPI into a fuller understanding of your game and how users are playing it.
- Session depth
Similar to session length, session depth signifies how “far” a user gets in game a before ending their session. It can help to think of how session depth differs on Instagram than it does on LinkedIn. On one app, you may find yourself simply checking for notifications then exiting out. On another, you may find yourself deeper into a session by reading various content.
If session depth remains consistently shallow, that’s most likely a sign that you don’t have enough compelling content to keep users engaged. Another possibility is that your user experience isn’t perfected yet. Perhaps users are exiting out because levels take too long to load, or choosing a character, inventory, etc. is too arduous a process.
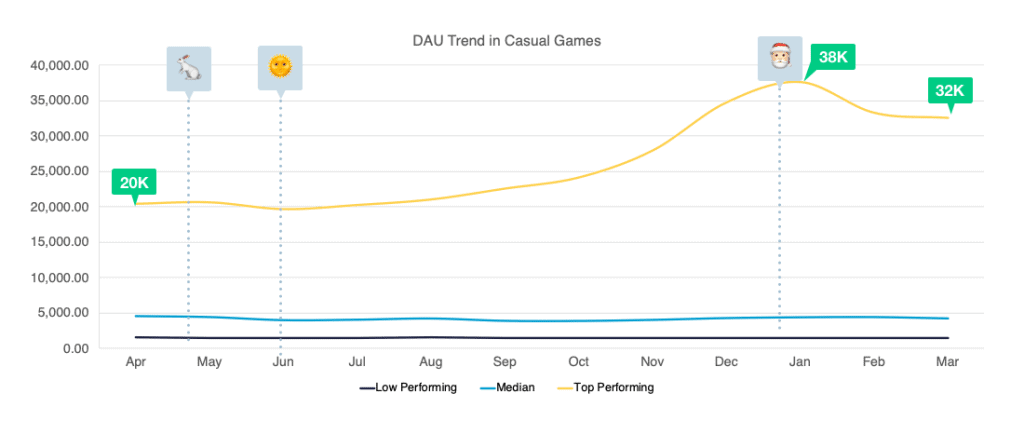
- Daily active users (DAU)
The DAU measures the number of users who play your game on a daily basis. CMOs in gaming can use the DAU for estimates and projections.

- Monthly active users (MAU)
Monthly active users is the number of people who have played your game within the past 30 days. Like the DAU, the MAU can give you insight into your program’s ability to retain users.
Additionally, dividing the number of daily active users from monthly active users reveals the user ratio percentage.
Again, this is useful information to help you understand the overall success your game is enjoying (or lacking).
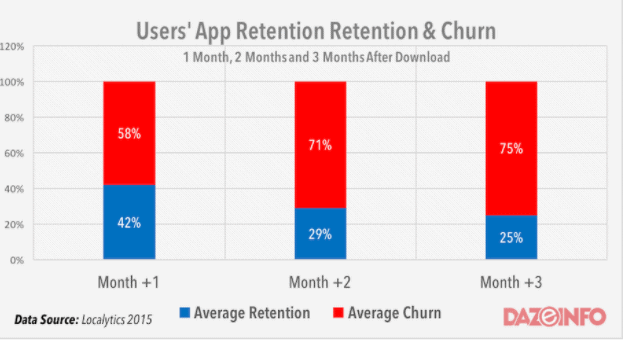
- Churn
The churn rate measures the percentage of active users who uninstall your application. Ideally, you want your game to have a low churn rate. If you have a high churn rate, look at your user experience, available content, and potential technical issues. Eliminating the causes in your control that lead to high churn rates will be an effective preventative strategy.
At the same time, mobile games naturally have a high churn rate–only 16 percent of games have a retention rate higher than 50 percent, while research has also shown that 85 percent of mobile game players do not return after the first day. This is also why it’s so important for mobile games to continue to sign up new players.

- Average revenue per user
The average revenue per user shows you the average amount of revenue one player generates for your company. This KPI is particularly relevant to your app if your game includes in-app purchases, paid subscriptions, and so on.
- Customer acquisition costs (CAC)
Customer acquisition costs (CAC) are the average cost of acquiring a player. Most gaming enterprises factor in sales and marketing expenses into their CAC. To calculate, you divide the costs total by the total of new customers:
CAC = Total expenses of acquiring new clients / total new acquired clients
The CAC helps evaluate sales and marketing tactics and provides insight into improving the return on investment (ROI). Chief marketing officers should pay attention to how the CAC varies between different marketing and sales strategies.
KPIs offer a road map to future success and a better understanding of exactly where you should channel your focus, attention, and creative management in the present.
Need help determining which KPIs are most important to your game? Contact us today to gain greater insight into the effectiveness of your marketing strategy.


